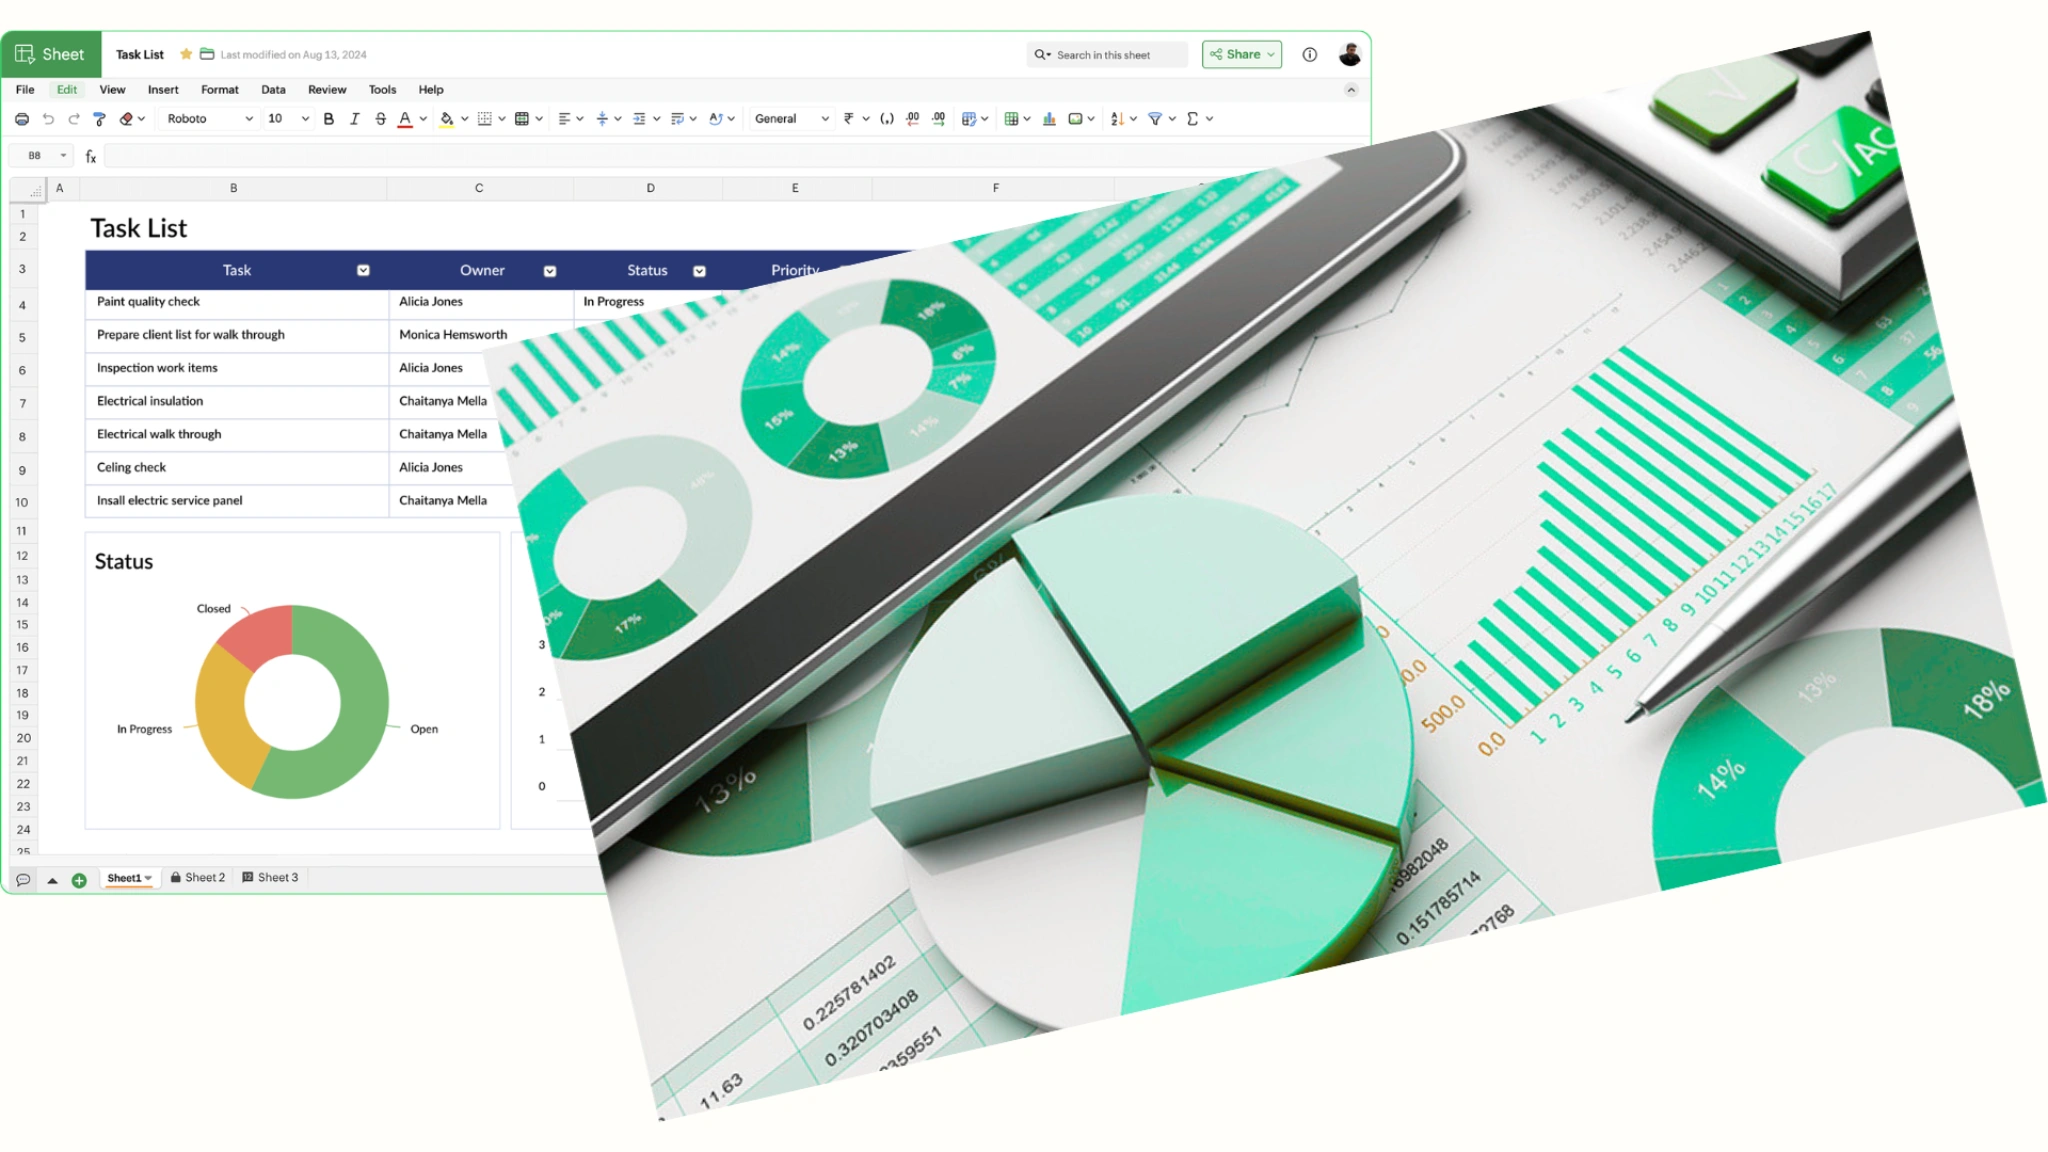
Year 2019 - 2020

TGG Craft

Launched the project as Product Growth & Marketing Manager

CONTEXT

Adaptive learning tool for SME & students

Students (consumer) have been using TGG Craft to Test and Analyse their performance in real-time environment in 3 biggest market in India (Delhi, Mumbai & Kolkata) for a while and now the small and medium businesses can also integrate. And this is just the beginning: soon we’ll add Mentor integration feature for same subscriptions.

Category: UPSC Mains preparation – Answer Writing & Evaluation tool

Segment: Competitive Exam Preparation (UPSC Civil Services Mains)

Geography: India

Delivery Platform: Web-based performance analysis Platform

Business Model: B2B (Primary User): Institutes

Executive Summary

The Problem

SMB UPSC coaching institutes run operationally blind — no purpose-built analytics tool exists for the segment. They rely on attendance registers and gut instinct.

The Product

TGG Craft: analytics-native SaaS delivering real-time student performance intelligence, cohort benchmarking, and customisable reporting. Already soft-launched with 10–50 paying institutes.

The Market

₹58,000 Cr India coaching industry. ~40,000+ SMB institutes. ~11L UPSC aspirants annually. SMB SaaS EdTech penetration at 12% — expanding fast.

The Model

Tiered freemium: Free (up to 50 students) → Pro ₹1.2L/yr → Enterprise (negotiated). 9-month GTM: 500 free installs → 47 paying customers → ₹58L Year 1 ARR.

Sources: IBEF 2023; UPSC Annual Report 2023; ASSOCHAM 2022; OpenView SaaS Benchmarks 2023; Bessemer VP Cloud Index 2023

₹5,800,000

Year 1 ARR target

₹63,830

Blended CAC

₹3,000,000

S&M Budget Ask

47

Year 1 Paid Customers

3.8x

LTV:CAC Ratio

9 Months

Campaign Duration

Market Landscape & Opportunity

₹58,000 Cr

India Coaching Industry Market Size (2020)

~₹1,100,000

UPSC Civil Services Aspirants Annually

~40,000+

Coaching Institutes in India (SMB segment)

Sources: IBEF India Education Sector Report 2023; UPSC Annual Report 2023; ASSOCHAM Education Report 2022

THE OPPORTUNITY GAP

India's UPSC coaching institutes are operationally blind — they run on attendance registers and gut instinct. No tool purpose-built for back-end student performance analytics exists for the SMB coaching segment. TGG Craft fills this white space.

Digital Acceleration

80%+ coaching institutes went hybrid post-2021

Data Demand

Institutes seek measurable ROI on teaching quality

UPSC Growth

Applications grew 18% YoY (2019 – 2020)

SaaS Adoption

SMB SaaS penetration in EdTech at ~12%, expanding fast

Fills the void between "Excel Chaos" and "Enterprise Bloat".

Data Silos

Institutes use fragmented tools for analysis, grades, and learning.

Manual Consolidation

Directors rely on manual spreadsheets to merge data, leading to errors.

Delayed Insights

Spreadsheet fatigue" results in reporting delays; intervention comes too late.

Strategy Snapshot

INSIGHT

UPSC institutes lack analytics visibility into student performance.
~40,000 SMB institutes run on attendance registers + gut instinct. Zero purpose-built analytics tool exists for the segment.

STRATEGY

Analytics-first SaaS with freemium PLG + sales-assisted conversion.
Free tier creates zero-friction adoption → Sales team lifts conversion 4%→6% → Pro at ₹1.2L/yr sits in WTP sweet spot (72% acceptance, N=22).

EXECUTION

Delhi NCR → Jaipur → Allahabad corridor expansion.
9-month phased GTM: UPSC coaching density drives city prioritisation. ₹30L S&M budget. 4 reps Phase 1 + product-led growth in parallel.

ICP: Navigating the Small & Medium Business Buying Center

The Initiator
(Head Tutor)

Frustrated by inability to track progress. Flags the issue.

The User (Tutors & Admins)

Daily operators. Fear complex software but hate manual entry. Need ease of use.

The Decision Maker
(Institute Director)

Budget holder. Cares about "Academic Outcomes" and Operational Efficiency.

The Gatekeeper
(IT / Finance)

The Skeptic. Concerned with implementation time, cost, and data security.

JOBS TO BE DONE

Activation

The Anxious Self-Studier

WHEN

When I sit down to practise and stare at a blank page, unsure if my structure is even correct,

I WANT

I want to submit one answer and receive a score with specific expert feedback within 24 hours,

SO WHAT

So that I prove to myself I can do this and build the daily habit.

↗ 87% of aspirants attempt <10 answers before Mains. Habit collapses without fast feedback.

B2B Adoption

The Institute Faculty Head

WHEN

When I'm spending 8–10 hrs/week grading answers and can't give individualised feedback at scale,

I WANT

I want a platform that evaluates answers on a consistent rubric and delivers structured feedback automatically,

SO WHAT

So that I reclaim grading time, standardise quality, and demonstrate measurable student progress.

↗ Beta: 4.1 hrs/week grading saved per institute. ROI 131% in Year 1 at ₹1.2L/yr.

Retention & Upgrade

The Plateaued Repeater

WHEN

When I've been writing for 3 weeks but can't tell if I'm improving — scores feel random and I don't know what to fix,

I WANT

I want a personal history showing my score trend by subject and highlighting my repeating weak spots,

SO WHAT

So that my effort feels like it's compounding — and I can justify upgrading before Mains.

↗ Beta: Avg score Δ +18 pts (D1→D30). Improvement history is the primary D30 upgrade trigger.

Competitive Landscape

Who We Sell To — Why We Win

Product
Focus
Analytics
Price
theGuruGyan
Analytics + Native
Deep & Real-time
Freemium + Subscription
Saval AI
LMS + content
Basic
~₹60K
TeyariApp
LMS + Live
Minimal
Freemium
Unacademy
LMS + content
Minimal
Freemium
DIY Sheets
Manual
Manual
Free

Positioning & Messaging

"The analytics-native SaaS built exclusively for UPSC coaching institutes — turning raw student performance data into actionable intelligence that prevents dropout and builds reputation."

INSTITUTE OWNER / DECISION MAKER

"Know who will crack UPSC — before results do."
Data-driven reputation, lower dropout, justify fee increases.

FACULTY / USER

"Stop guessing. Teach with precision."
Topic-level heatmaps + cohort comparisons — built for your dashboard.

UPSC ASPIRANT (ENABLER)

"Your coaching institute finally sees you."
Personalised progress reports. Close weak-zone gaps before exam day.

Pricing Strategy

Tiered Freemium | Van Westendorp Sweet Spot: ₹1.0L–₹1.4L/yr | ROI: 1.3x on Retention Alone

Self-serve sign-up

FREE

₹0

Forever

✓  Up to 50 students

✓  Basic performance dashboard

✓  3 custom reports/month

✓  Email support

✓  TGG branding on reports

Self-serve sign-up

Most Popular ★

PRO

₹1,20,000

Per Year (₹10K/month)

✓  Unlimited students

✓  Real-time analytics dashboard

✓  Unlimited custom reports

✓  Cohort benchmarking

✓  Priority onboarding

✓  White-label reports

Sales-led conversion

SQL Pipeline

ENTERPRISE

Negotiated

Annual Contract

✓  All Pro features

✓  Multi-branch management

✓  Custom integrations

✓  Dedicated account manager

✓  SLA-backed uptime

✓  Custom contract terms

Direct sales

WTP EVIDENCE: Survey of 22 institute owners — ₹1.0L–₹1.4L optimal zone (72% acceptance).
Pro at ₹1.2L sits in sweet spot.
VALUE-TO-PRICE: 1.3x ROI on retention alone — institute retaining just 12 extra students @ ₹10K fees covers full tool cost.
Full conjoint study recommended pre-Series A.

Go-To-Market Timeline

9-Month Phased GTM

PHASE 1 | Month 1 – Month 3

Awareness & Acquisition

MARKETING

  • LinkedIn: Institute owners (job title targeting)
  • Meta: UPSC aspirants 22–28 yrs
  • Free trial push — zero-friction signup


SALES

  • 6 reps: cold outreach to 200+ student institutes
  • Free trial pitch — zero-cost entry
  • UPSC coaching expo attendance

GOAL: 500 free installs, 5 paid

PHASE 2 | Month 4 – Month 6

Adoption & Engagement

MARKETING

  • Meta retargeting of free-tier users
  • LinkedIn thought-leadership content
  • Email nurture sequences


SALES

  • Upgrade calls to 30–60 day free users
  • Weekly product demo webinars
  • Case study creation from paid adopters

GOAL: 30 paid, 60% activation

PHASE 3 | Month 7 – Month 9

Retention & Advocacy

MARKETING

  • Referral: ₹5K credit per referred paying institute
  • Success story content
  • NPS-triggered advocacy


SALES

  • Enterprise SQL pipeline (2 targets)
  • Annual contract renewals
  • Partner channel exploration

GOAL: 47 paid, ₹58L ARR

Marketing Channel Mix & Campaign Plan

Marketing Channels

LinkedIn Ads

Target: Institute owners, directors, academics heads
KPI: CPL < ₹400 | 40% of media budget

Meta Ads

Target: UPSC aspirants (22–28 yrs), coaching institute pages
KPI: ROAS > 3x | 45% of media budget

Google Display

Target: Intent-based: 'UPSC coaching software', 'student analytics'
KPI: CTR > 1.5% | 15% of media budget

In-House Sales Team

Team Size:

6 Sales Personnel (hired & onboarded)

Coverage:

Delhi, Mumbai & Kolkata

Target/Rep:

~8–10 institute visits/week

Primary Motion:

Free-trial pitch → demo → upgrade

SQL Criteria:

200+ students, active trial user, engaged director

Enterprise Path:

Negotiated annual contracts (₹1.2L+ custom)

Sales Enablement Strategy

Sales Playbook

Objection handling scripts, demo flow guide, ideal talk-track for institute owners. Covers Free → Pro upgrade conversation.

Product Demo Kit

Live sandbox environment + pre-loaded institute data. 15-minute guided demo script tailored to UPSC coaching pain points.

ROI Calculator

Excel-based tool: input institute size, fee structure → outputs projected retention uplift & revenue impact from TGG Craft adoption.

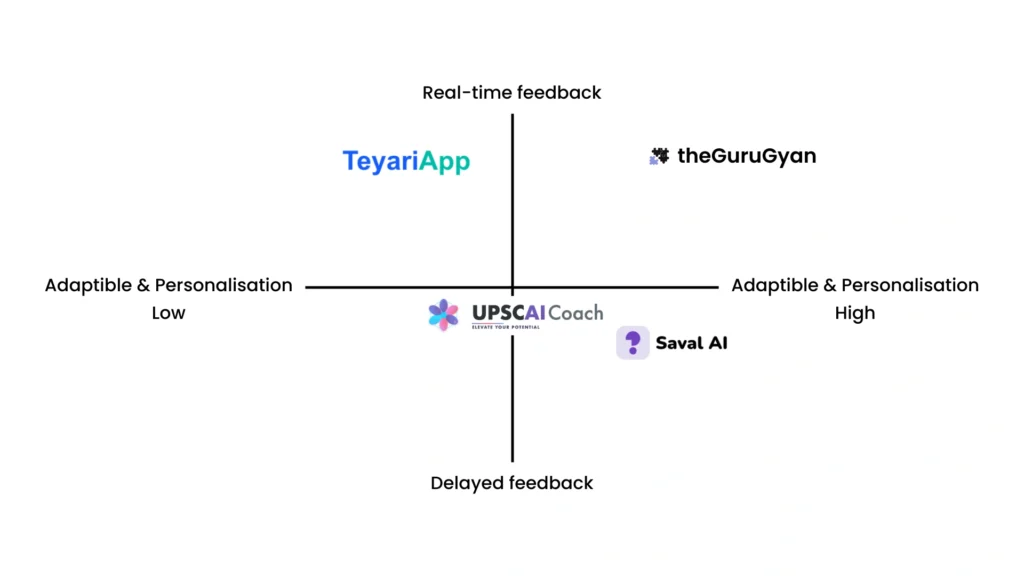
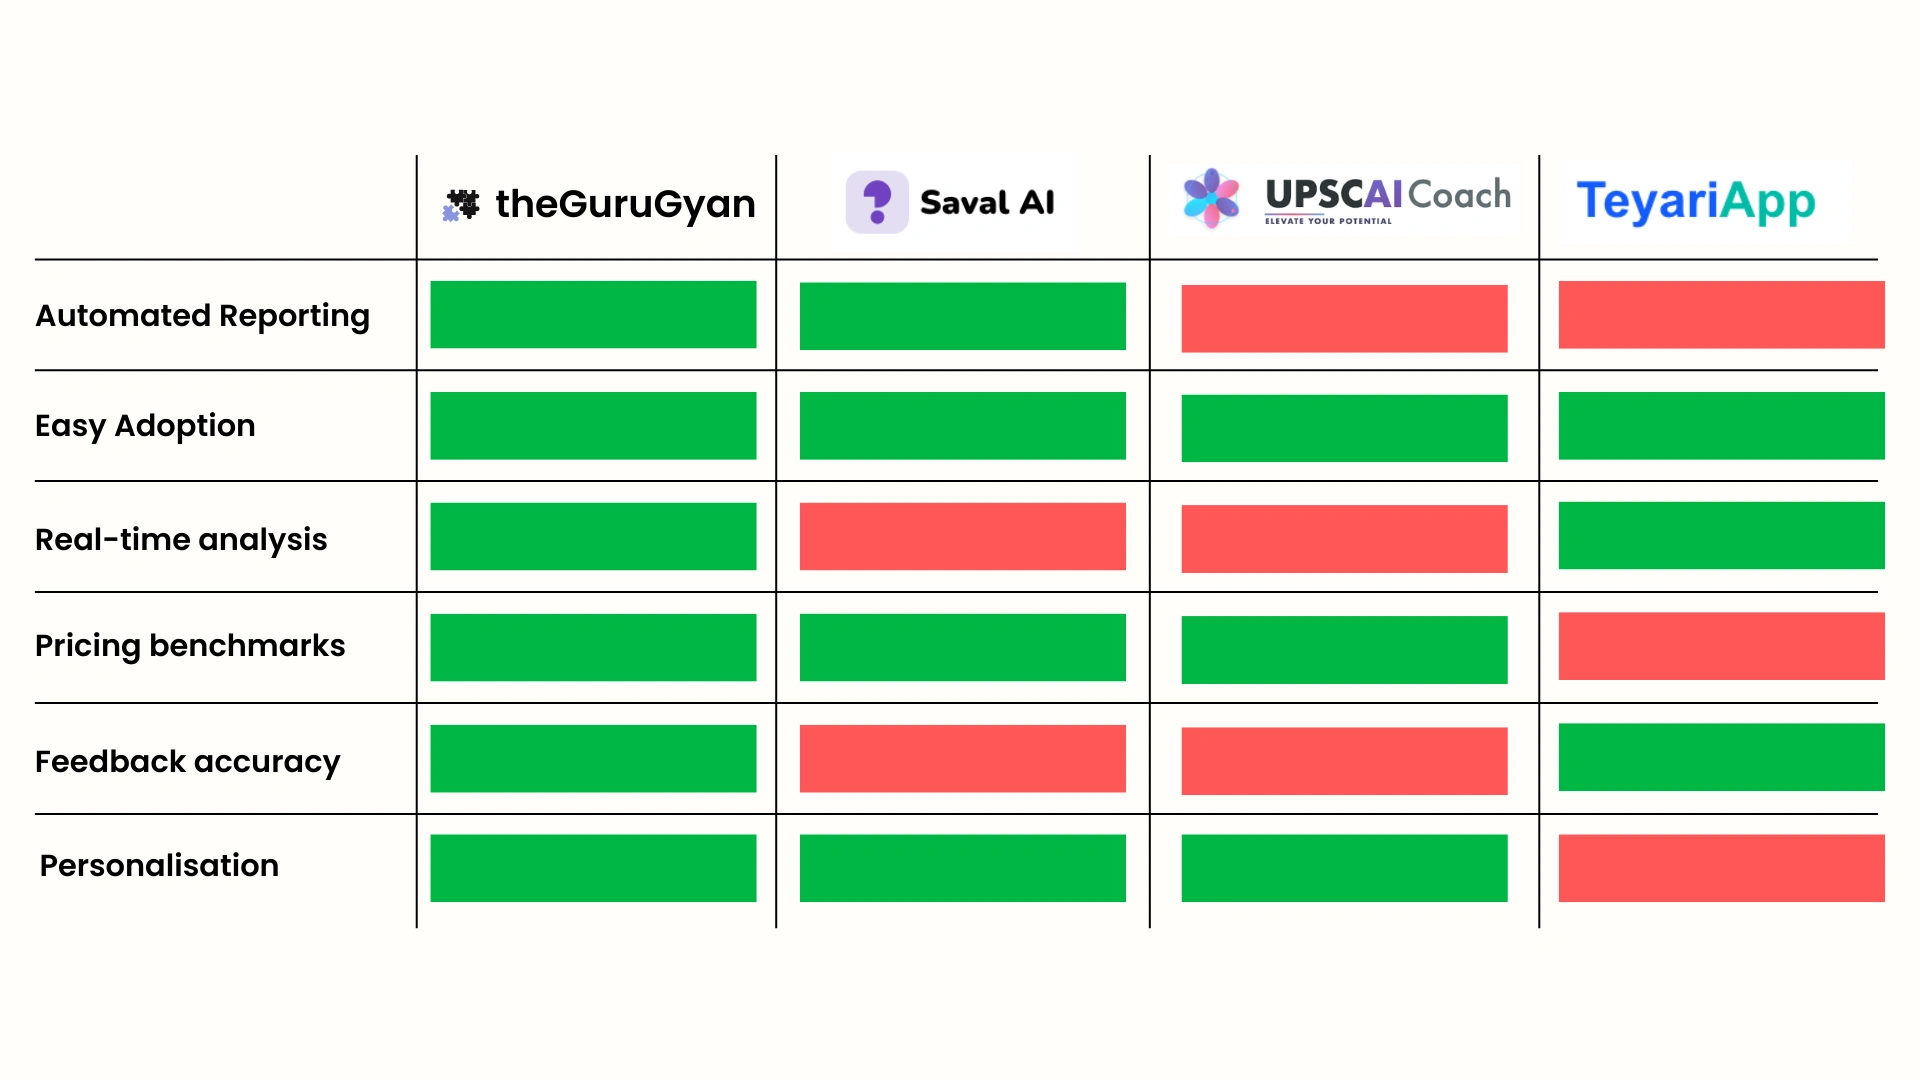
Battlecard vs Competitors

One-page comparison: TGG Craft vs UPSC Coach, Unacademy, TeyariApp. Objection-handling for 'we already use X'.

Case Study Pack

2–3 pilot institute success stories (cohort improvement data, director quotes). Used for social proof in later stages.

CRM & Lead Tracking

Standardised CRM workflow: Lead → Demo Booked → Trial → SQL → Paid. Weekly pipeline review by sales lead.

Sales Collaterals

Campaign Metrics Framework

PHASE 1: M1–M3

Awareness & Acquisition

PHASE 2: M4–M6

Adoption & Engagement

PHASE 3: M7–M9

Retention & Advocacy

Cost Per Lead (CPL)

TARGET: < ₹350

LinkedIn+Meta spend ÷ qualified leads

Product Activation

TARGET: > 60%

% completing first analytics report

Blended CAC

TARGET: > 3.0x

Revenue attributed ÷ ad spend

ROAS

TARGET: > 3.0x

Revenue attributed ÷ ad spend

Free-to-Paid Conversion

TARGET: 3–5%

% free → Pro in 90 days

LTV:CAC (Pro)

TARGET: > 3.8x

₹2.4L LTV ÷ ₹63.8K CAC

Free Trial Sign-Ups

TARGET: 500

Self-serve + sales installs

Weekly Active Usage

TARGET: > 40% WAU

Unique logins / total installs

NPS

TARGET: > 40

30-day + 90-day in-app survey

Website Traffic

TARGET: 10K/mo

GA4 — organic + paid

Time-to-Value (TTV)

TARGET: < 7 days

Days: signup → first analytics insight

Net Revenue Retention

TARGET: > 110%

Expansion + upsell vs churn

CAC target revised from ₹25K to <₹65K reflecting unified blended CAC formula (total S&M ÷ 47 customers).
Source: Bessemer VP Cloud Index 2023; OpenView SaaS Benchmarks 2023.

RISK Assessment

Final Thoughts

1. Sales Capacity ≠ Year 1 Actuals

6 reps can handle 210+/yr at steady state.
Year 1 = 47 due to ramp.
This gap is healthy — year 2 ARR should be ₹2–3x Year 1 with same team.

2. CAC Transparency is a Strength

Blended CAC ₹63,830 is honest.
LTV/CAC 3.8x is above minimum.
Team should focus on improving this ratio — target 6x+ by end of Year 2.

3. Freemium Conversion is the Lever

Moving conversion from 4% to 6% via sales-assist adds 10 customers and ~₹12L ARR.
Every 1% point improvement = ₹6L ARR.

4. Analytics is the Moat

First-mover data lock-in (historical trends) creates switching cost after Year 1.

Sensitivity Analysis — Does ₹30L Hold Up?

SCENARIO
CONV%
RETENTION
CAC
CUSTOMER
YEAR 1 ARR
LTV
LTV/CAC
PAYBACK
₹30L JUSTIFIED?
WORST CASE
1%
1yr
₹45K
7
₹8.4L
₹1.2L
2.7x
22 Month
✗ No
BASE CASE ★
4%
2yr
₹64K
22
₹26.4L
₹2.4L
3.75x
16 months
✓ Yes
ACTUAL
6%
2yr
₹64K
47
₹58L
₹2.4L
3.8x
16 months
✓ Yes
BEST CASE
8%
4yr
₹40K
42
₹50.4L
₹4.8L
12x
10 months
✓ Yes

2-D SENSITIVITY GRID: YEAR 1 ARR (₹ LAKHS) × Conversion % (rows) vs Retention Years (cols)

Conv\ Ret→
1 Yr
2 Yr
3 Yr
4 Yr
1%
₹10.0L
₹10.0L
₹10.0L
₹10.0L
2%
₹16.0L
₹16.0L
₹16.0L
₹16.0L
4%
₹28.0L
₹28.0L
₹28.0L
₹28.0L
6%
₹40.0L
₹40.0L
₹40.0L
₹40.0L
8%
₹52.0L
₹52.0L
₹52.0L
₹52.0L

GREEN=₹40L+ | BLUE=₹20–40L (base acceptable, ₹30L justified) | RED=<₹20L (budget not justified) | Board watch metric: conversion rate at M3 checkpoint.

Budget & Channel Unit Economics

₹30L S&M Budget | Per-Channel CPL, Conversion & CAC | 90-Day Test Gates

CATEGORY
ALLOC%
INR AMOUNT
PRIMARY KPI
Digital Media (LinkedIn+Meta+Google)
40%
₹12,00,000
CPL + ROAS
In-House Sales Team (4 reps Phase 1)
40%
₹12,00,000
Demo-to-trial + paid conversion
Events & Content
12%
₹3,60,000
Brand + enablement
Sales Tools & CRM
5%
₹1,50,000
Pipeline efficiency
Contingency (A/B test reserve)
3%
₹90,000
Channel pilots
TOTAL
100%
₹30,00,000

PER-CHANNEL UNIT ECONOMICS (CORRECTED — CONSERVATIVE BENCHMARKS)

CHANNEL
BUDGET
CPL
LEADS
TRIAL CONV
TRIALS
PAID CONV
CAC CONTRIB
LinkedIn
₹4.8L
₹320
1,500
15%
225
8%
₹26,700
Meta
₹5.4L
₹190
2,842
12%
341
5%
₹31,700
Google
₹1.8L
₹420
429
10%
43
6%
₹70,000
Sales (direct)
₹12.0L
₹640*
1,875*
55%
1,031
4%**
₹19,300

90-DAY TEST GATES: LinkedIn CPL12% | Meta CPL2.5x | Sales demo-to-trial>40% — if any gate fails, pause and revise before full budget unlock. Sources: Gartner B2B SaaS Funnel 2020; ChiefMartec Freemium 2020.

Pilot Evidence & Year 1 Business Model

Soft-Launch Data | Unified Customer Projection | ARR Trajectory

PILOT METRICS (SOFT-LAUNCH COHORT)

KPI
Inst. A (Delhi NCR)
Inst. B (Jaipur)
Board Gate
Product Activation
68%
61%
> 60% ✓
Weekly Active Usage
3.4x/wk
2.8x/wk
> 2.5x ✓
Time-to-Value
5 days
8 days
< 7 days ✓/⚠
Initial NPS (30-day)
47
39
> 40 ✓/⚠

BOARD M3 GATE: Activation>60% | WAU>2.5x | NPS>40 | 5+ paid conversions

UNIFIED YEAR 1 MODEL (CORRECTED)

Free Tier Installs Target
500
Free-to-Paid Conv (sales-assisted)
6%
PLG Paid Customers
30
Net-New Sales-Direct Customers
15
Enterprise Customers (SQL)
2
TOTAL YEAR 1 PAID CUSTOMERS
47
Pro ARR (45 × ₹1.2L)
₹54L
Enterprise ARR (2 × ₹2.0L)
₹4L
TOTAL YEAR 1 ARR
₹58L
Blended CAC (₹30L ÷ 47)
₹63,830
LTV Pro (₹1.2L × 2yr)
₹2,40,000
LTV:CAC
3.8x

ARR Build: M1–M3: ₹3L | M4–M6: ₹18L | M7–M9: ₹37L | YE: ₹58L

INTERNAL ALIGNMENT & CROSS-FUNCTIONAL FRAMING

GTM ACTIVITY
PRODUCT
PMM
SALES & MARKETING
DATA / ENGG.
TIMELINE
Habit loop feature (streaks, nudges)
R
C
I
A
M1–3
Positioning & messaging
C
R
I
I
M1–2
Landing page copy + A/B test
I
R
A
C
M2–3
Launch creative + campaign
I
R
A
I
M3–4
Institute demo deck & ROI calc
I
R
A
I
M2–3
Beta → scale on-boarding flow
A
C
R
R
M4–5
Churn cohort analysis
C
R
I
A
Monthly
Quarterly GTM review (QBR)
A
R
C
C
Quarterly
Product roadmap from market signals
A
R
C
I
Monthly

R Responsible

A Accountable

C Consulted

I Informed